Audit Logs in Data Pipeline Studio
The Calibo Accelerate platform provides audit logs in Data Pipeline Studio. The logs provide details of events and activities related to data pipelines and other objects in Data Pipeline Studio. The objects include nodes, connectors, and technologies. The details in the audit logs also include the portfolio, product, feature, and release with which the data pipeline is associated.
For a cloud-native platform like Calibo Accelerate, which integrates with several cloud technologies, audit logs are not only useful in troubleshooting errors, but also serve an important purpose of legal and security compliance.
To view the audit logs in Data Pipeline Studio
-
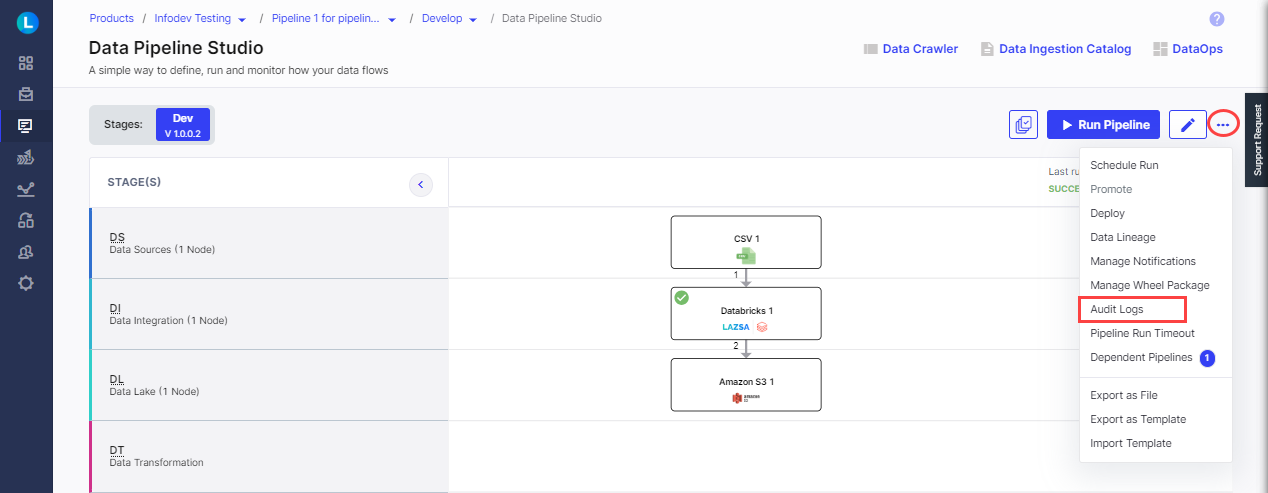
In Data Pipeline Studio, click the ellipsis (...) and then click Audit Logs to view the logs.

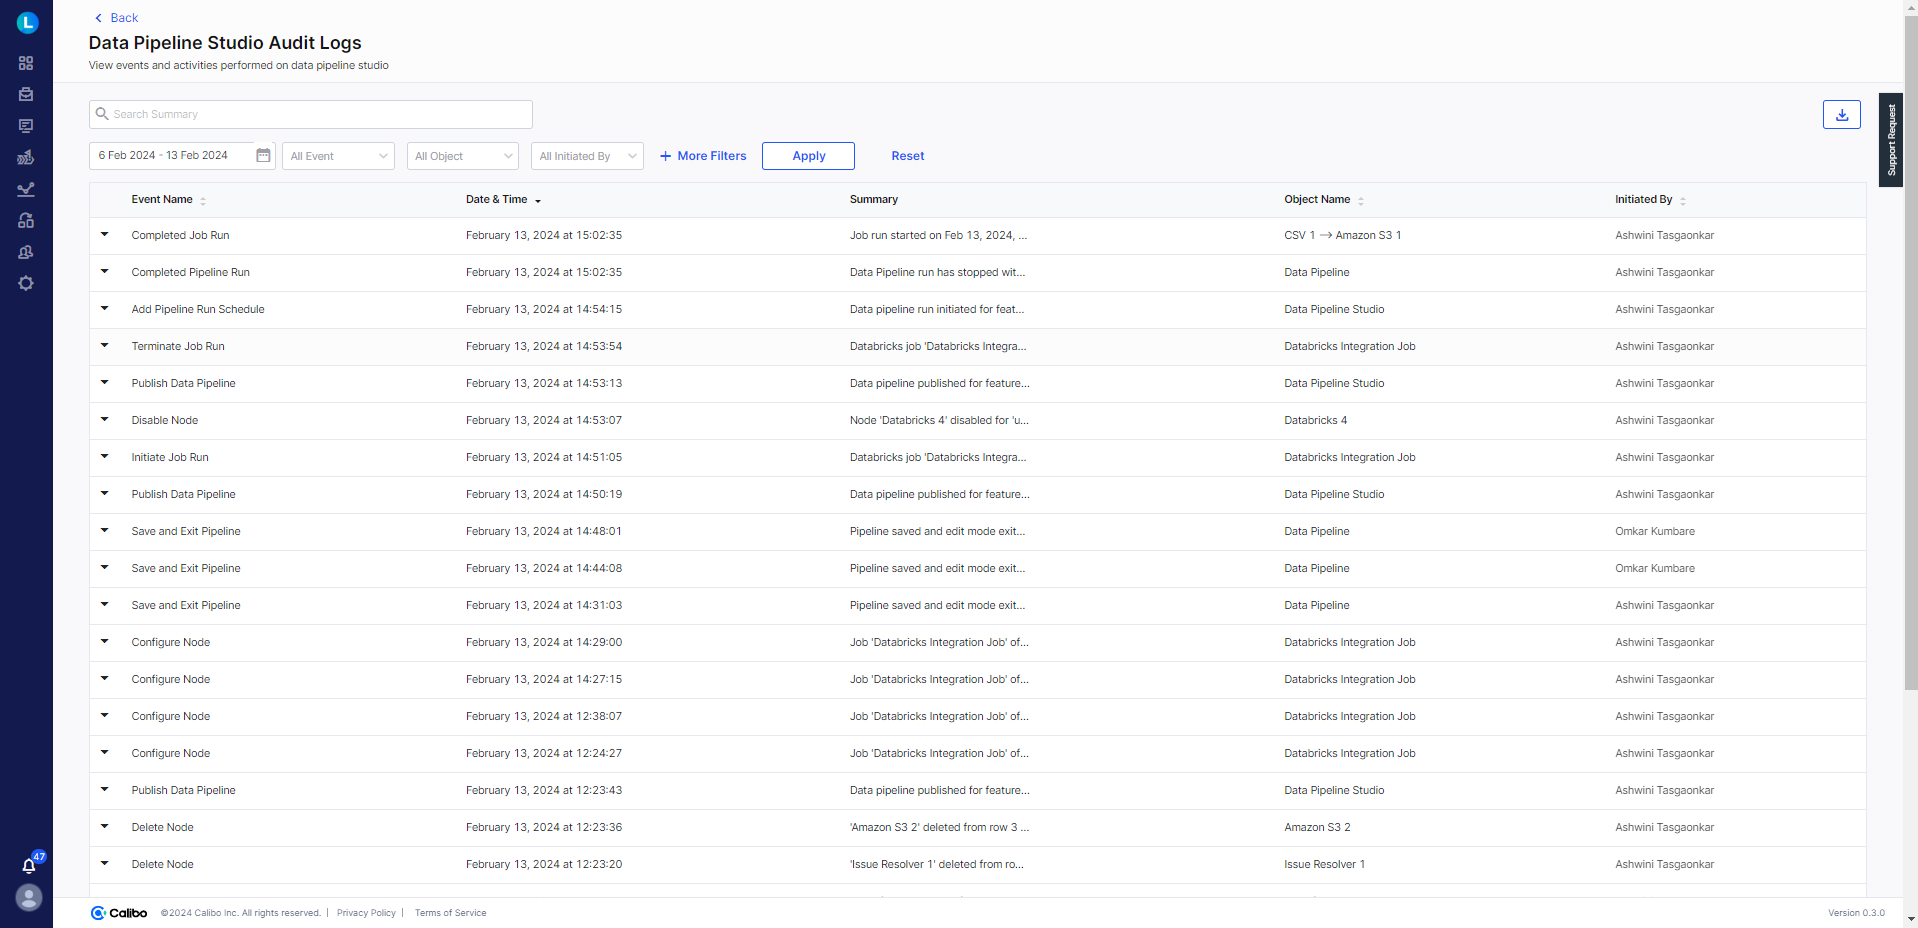
On the Data Pipeline Studio Audit Logs screen, you can view the following details:

-
Event Name - the name of the event. Some examples include adding a node, initiating a job run, adding a connector, publishing a data pipeline.
-
Date & Time - The date and exact time when the event is logged.
-
Summary - A brief description of the event.
-
Object Name - The name of the object for which the event is logged. Some examples include a technology, stage, job.
-
Initiated By - The name of the user who initiated the event.
-
-
You can perform the following operations on the audit logs screen:
-
Search for a log by specifying the summary.
-
Filter the logs using the following options, based on the logs you want to view:
-
Click the Calendar icon and specify the period.
-
Event Name - Select all events or specific events.
-
Object - Select all objects or specific objects.
-
All Initiated By - Select all names or specific names.
-
-
Sort the following columns by clicking the arrows adjacent to the column name:
-
Event Name - the column is sorted in alphabetical order.
-
Date & Time - the column is sorted in chronological order.
-
Object Name - the column is sorted in alphabetical order.
-
Initiated By - the column is sorted in alphabetical order.
-
-
View Additional Details - Click the down arrow adjacent to the event name to view additional log details about the event.
-
Download - click
 to download the logs:
-
Provide a name for the report.
-
Select either PDF or CSV format in which you want to download the report.
-
-
Pagination - click Showing and then select one of the options - 25,30, 50. By default 10 records are shown.
-
-
If you want to use more filters than those available, then click + More Filters. Select the filter and click Apply.
-
To reset the applied filters, click Reset.
| What's next? your susRun and Monitor a Data Pipeline |